
Formelspråket som används i Power BI heter DAX. Språket utgörs av ett stort antal funktioner med konstanter och operatorer vilka används i formler och uttryck för att beräkna ett eller flera värden. DAX skapar helt enkelt ny information utifrån data som redan finns i din datamodell.
Funktionerna i DAX delar vi in i följande grupper: DATETIME, FILTER, INFO, LOGICAL, MATHTRIG, PARENTCHILD, STATISTICAL, TEXT, TIMEINTELLIGENCE samt OTHER.
DAX Function: SUM
Reference group: MATHTRIG
Att summera ihop värden är ett vanligt förekommande moment när du arbetar med numerisk data. I Power BI kan det göras på olika sätt beroende på hur din datamodell ser ut. Finns alla värden du vill summera i en kolumn gör du det enkelt med SUM-funktionen. Finns inte alla värden i en kolumn utan är uppdelade i två eller fler kolumner t ex det du behöver summera är lagrat per enhet i två olika kolumner, ”Antal sålda enheter” i en kolumn och ”Pris per enhet” i en annan kolumn. Då kan du först räkna ut summan för varje enhets försäljning och spara värdet i en ny kolumn för att sedan använda SUM-funktionen på den nya kolumnen.
Det finns andra sätt att lösa detta utan att behöva skapa nya kolumner i datamodellen men det tar vi upp i en annan blogg. Här visar vi summering genom att summera ihop en befintlig eller en nyskapad kolumn.
SUM generar inte en ny kolumn utan returnerar ett beräknat värde, ett så kallat Measure. Measures lagras inte i datamodellen utan beräknas vid varje tillfälle de anropas. Beroende på hur ett Measure används genereras olika resultat. Exempel på andra användningar av Measures tar vi upp i andra bloggar.
SUM function (DAX)
SUM-funktionen returnerar summan av alla värden i en kolumn i en tabell och kan endast användas på numeriska kolumner. I kolumnhänvisningen kan även tabellnamnet anges.
Syntax: SUM(<column>)
I exempel 1 använder vi en tabell som heter DATA_4 med 4 kolumner enligt nedan:
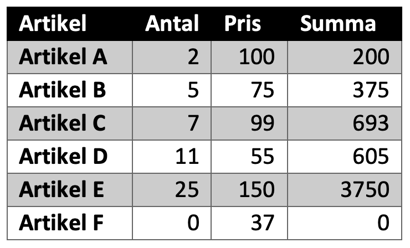
Exempel 1
I exemplet summerar vi ihop värden i kolumnen Summa. Measure ”Total” används och innehåller summan.
Total = 5623
För att beräkna ”Total” använder vi följande syntax:
Total = SUM(’DATA_4’[Summa])
Exempel 2
I exempel 2 använder vi en tabell som heter DATA_3 med 3 kolumner enligt nedan: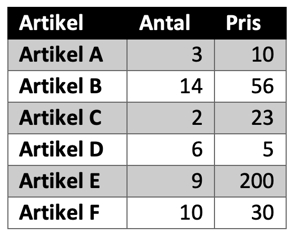
Först lägger vi till en kolumn som vi kallar ”SummaNy” och tabellen får följande utseende: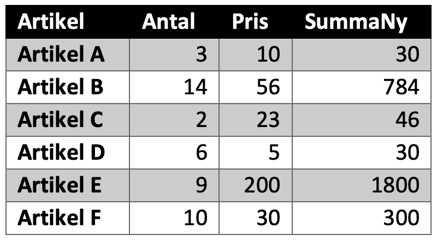
För lägga till kolumn ”SummaNy” använder vi följande syntax:
SummaNy = ‘DATA_3’[Antal]* ‘DATA_3’ [Pris]
Sedan summerar vi ihop värden i kolumnen SummaNy. Measure ”TotalNy” används och innehåller summan.
TotalNy = 2990
För att beräkna ”TotalNy” använder vi följande syntax:
TotalNy = SUM(’DATA_3’[SummaNy])
Flera MATHTRIG funktioner (DAX)
Ovan har du fått exempel på hur du kan summera värden i kolumner med SUM-funktionen. Det finns ytterligare 44 MATHTRIG-funktioner i Power BI. Vill du veta mer vilka MATHTRIG-funktioner som finns i Power BI kan du ladda ner vår Power BI applikation som visar alla MATHTRIG-funktioner.

För att kunna använda Power BI applikationen behöver du ha Power BI Desktop installerad på din dator. Power BI Desktop är gratis och kan laddas ner här.
Vi kan naturligtvis hjälpa till med installation och att komma igång med PBI.
Håll utkik efter ytterligare blogginlägg.