<img src="https://secure.leadforensics.com/133892.png" alt="" style="display:none;">

DAX - Data Analysis Expressions

Formelspråket som används i Power BI heter DAX. Språket utgörs av ett stort antal funktioner med konstanter och operatorer vilka används i formler och uttryck för att beräkna ett eller flera värden. DAX skapar helt enkelt ny information utifrån data som redan finns i din datamodell.

Funktionerna i DAX delar vi in i följande grupper: DATETIME, FILTER, INFO, LOGICAL, MATHTRIG, PARENTCHILD, STATISTICAL, TEXT, TIMEINTELLIGENCE samt OTHER.


DAX Function: COUNTROWS / FILTER

Reference group: STATISTICAL / FILTER

Hur många kunder har du i ditt kundregister på en viss ort? För att ta reda på detta behöver du kombinera funktionerna COUNTROWS och FILTER.

COUNTROWS-funktionen räknar antalet rader i en tabell i din datamodell. Antal rader som räknas i tabellen styrs av definitionen i FILTER-funktionen.

COUNTROWS function (DAX)

COUNTROWS-funktionen returnerar antalet rader i en datatabell och eftersom det är antalet rader i hela tabellen som räknas skall ingen kolumn anges. Samtliga rader räknas oavsett om de innehåller data eller inte.

COUNTROWS generar inte en ny kolumn utan returnerar ett beräknat värde, ett så kallat Measure. Measures lagras inte i datamodellen utan beräknas vid varje tillfälle de anropas/används. Beroende på hur ett Measure används genereras olika resultat. Exempel på andra användningar av Measures kommer vi ta upp i andra bloggar.

Syntax: COUNTROWS(<table>)

FILTER function (DAX)

Med FILTER-funktionen begränsar du antalet rader i tabellen du vill göra en beräkning på. Du anger vilken tabell och kolumn samt vilket värde i kolumnen som skall begränsa tabellen. FILTER-funktionen kan användas tillsammans med en mängd andra funktioner vilket vi kommer att ta upp i andra bloggar.

Syntax: FILTER(<table>;<filter>) 

COUNTROWS function (DAX) + FILTER function (DAX)

Kombinationen av COUNTROWS-funktionen och FILTER-funktionen är en användbar och vanlig kombination om man behöver räkna antalet av ett visst värde i en kolumn. Definitionen i FILTER-funktionen bestämmer resultatet.

Syntax: COUNTROWS (FILTER (<table>;<expression>))

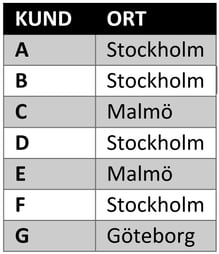
I exemplen använder vi en tabell som heter KUND_ORT med 2 kolumner enligt nedan:

Table

Exempel 1.

I exemplet räknar vi antal rader i tabellen KUND_ORT där kolumnen ORT innehåller Stockholm dvs hur många kunder har vi i Stockholm. Measure ”Antal KUNDER i Sthlm” används och innehåller resultatet.

Antal KUNDER i Sthlm = 4
 
För att beräkna ”Antal KUNDER i Sthlm” använder vi följande syntax:

Antal KUNDER i Sthlm = COUNTROWS(FILTER('KUND_ORT’; 'KUND_ORT’ [ORT]=”Stockholm”))

Exempel 2.

I exemplet räknar vi antal rader i tabellen KUND_ORT där Ort inte är Stockholm dvs hur många kunder har vi som inte finns i Stockholm. Measure ”Antal KUNDER utanför Sthlm” används och innehåller resultatet.

Antal KUNDER utanför Sthlm = 3
 
För att beräkna ”Antal KUNDER utanför Sthlm” använder vi följande syntax:

Antal KUNDER utanför Sthlm = COUNTROWS(FILTER('KUND_ORT’; 'KUND_ORT’ [ORT]<>”Stockholm”))

Flera STATISTICAL / FILTER funktioner (DAX)

Ovan har du fått exempel på hur du kan räkna antal rader i en tabell med COUNTROWS-funktionen i kombination med FILTER-funktionen. Det finns ytterligare 68 STATISTICAL- och 24 FILTER-funktioner i Power BI.

Vill du veta mer vilka STATISTICAL och FILTER-funktioner som finns i Power BI? Ladda då ner våra Power BI applikationer som visar alla STATISTICAL och FILTER-funktioner.
Ladda ner STATISTICAL

Ladda ner FILTER

För att kunna använda Power BI applikationer behöver du ha Power BI Desktop installerad på din dator. Power BI Desktop är gratis och kan laddas ner här, https://powerbi.microsoft.com/sv-se/desktop/.

Vi kan naturligtvis hjälpa dig med installation och att komma igång med PBI.

Håll utkik efter ytterligare blogginlägg .......

Ämnen

Diskutera detta inlägg

Rekommenderad läsning

If you organize your data and use AI strategically, you can make better decisions faster. You can for example improve your market understanding and forecasting, optimize your maintenance or reduce food waste. Choose what is most important for you!
Demand forecasters do the impossible — predict what products and services customers want in the future. Their forecasts inform decision-making about production and inventory levels, pricing, budgeting, hiring and more. "While crystal balls remain imaginary, machine learning (ML) methods can give global supply chain leaders the support they need in the real world to create more accurate forecasts." The goal is to produce exactly the amount of product to meet demand. No more. No less. Demand forecasting is used to anticipate the demand with enough time to manufacture the right stock to get as close to this reality as possible. The cost is high if you don’t get it right. Your customers will go to your competitors if you don’t have what they need. Unfortunately, capacity, demand and cost aren’t always known parameters. Variations in demand, supplies, transportation, lead times and more create uncertainties. Ultimately demand uncertainties greatly influence supply chain performance with widespread effects on production scheduling, inventory planning and transportation. On the heels of the global pandemic, supply chain disruptions and a pending economic downturn, many demand forecasters wish for a crystal ball. While crystal balls remain imaginary, machine learning (ML) methods can give global supply chain leaders the support they need in the real world to create more accurate forecasts.
If you have identified possible AI use cases for your business, the next step will be to test if they are possible to implement and if they will create great value. While there is a lot of momentum and excitement about using AI to propel your business, the reality is only 54% of AI projects are deployed. How do you ensure you’re one of the businesses that does unlock the new opportunities AI promises? Your success with AI begins by discovering AI use cases that work for your business. In the first blog of our Columbus AI blog series, we shared five areas where organizations should focus their efforts to generate ideas for AI implementations based on our experience. After generating some ideas for AI use cases that could potentially benefit your company from the first step of the Columbus AI Innovation Lab, the next step is to test which AI use cases could be operationalized by evaluating them. Columbus AI Innovation Lab
Only half of the companies starting an AI pilot project are actually executing it. The key is to choose an idea that will benefit your business. Read more about how! In 2022, 27% of chief information officers confirmed they deployed artificial intelligence (AI), according to a Gartner AI survey. Even though businesses across all industries are turning to AI and machine learning, prepare your organization before jumping on the AI bandwagon by considering a few factors. Ask yourself: Is AI necessary for achieving the project requirements or is there another way? Does your team have the skills to support AI and machine learning? How will AI impact your current operations if you adopt it? How will you integrate AI with existing systems? What are the data, security and infrastructure requirements of AI and machine learning? The Gartner AI survey found only 54% of projects made it from the pilot phase to production. After significant investment in AI, why aren’t companies deploying it? We found the problem begins when companies define a use case. Too often, companies are not identifying AI use cases that benefit their businesses and end-users will adopt. The question is then, how should companies unlock the value and new opportunities AI promises? It starts with a systematic approach for each stage of the AI life cycle. We developed the Columbus AI Innovation Lab, a comprehensive method to address and account for all challenges when adding AI to your business operations and bring stakeholders into the process at the right time to help you operationalize AI.
It doesn’t matter how good your artificial intelligence technology is. If you have bad data, you’ll get bad results. While AI is one of the most innovative and impactful innovations for businesses today, bad data can prevent AI projects from getting off the ground. Having high-quality data and following data preparation best practices are crucial for a successful AI project. In the Transform phase of the Columbus AI Innovation Lab, the one we detail here, data is collected and prepared for use by AI and machine learning (ML) algorithms. Major phases in Machine Learning Machine learning, frequently used synonymously with “artificial intelligence,” is about using predictive methods to simplify tasks. There are several essential steps to building ML models, and these steps can change based on the issue you are trying to solve and the kind of ML model you are building. However, in general, the steps involved in creating and implementing an ML model are as follows: Define: Different approaches for finding AI use cases Discover: Scope and prioritize ideas before developing an AI solution and implementation strategy Transform: Transforming the business case including data acquisition and preparation with AI/ML (current blog) Model and evaluate: Analyze and enhance the business use cases using AI/ML algorithms Deploy and support: Deployment of AI/ML models and support/monitoring to guarantee quality and effectiveness
right-arrow share search phone phone-filled menu filter envelope envelope-filled close checkmark caret-down arrow-up arrow-right arrow-left arrow-down right-arrow share search phone phone-filled menu filter envelope envelope-filled close checkmark caret-down arrow-up arrow-right arrow-left arrow-down