
It doesn’t matter how good your artificial intelligence technology is. If you have bad data, you’ll get bad results. While AI is one of the most innovative and impactful innovations for businesses today, bad data can prevent AI projects from getting off the ground.
Having high-quality data and following data preparation best practices are crucial for a successful AI project. In the Transform phase of the Columbus AI Innovation Lab, the one we detail here, data is collected and prepared for use by AI and machine learning (ML) algorithms.
Major phases in Machine Learning
Machine learning, frequently used synonymously with “artificial intelligence,” is about using predictive methods to simplify tasks. There are several essential steps to building ML models, and these steps can change based on the issue you are trying to solve and the kind of ML model you are building. However, in general, the steps involved in creating and implementing an ML model are as follows:
- Define: Different approaches for finding AI use cases
- Discover: Scope and prioritize ideas before developing an AI solution and implementation strategy
- Transform: Transforming the business case including data acquisition and preparation with AI/ML (current blog)
- Model and evaluate: Analyze and enhance the business use cases using AI/ML algorithms
- Deploy and support: Deployment of AI/ML models and support/monitoring to guarantee quality and effectiveness
The Columbus AI Innovation Lab: Make artificial intelligence work for your business
.png?width=760&height=349&name=MicrosoftTeams-image%20(35).png)
Data transformation: Convert business objectives and challenges into data
After you have identified, evaluated, prioritized and selected your AI use case, there is a ML problem to solve. Any machine learning method’s fundamental building block is data. After generating a precise ML problem, the next step is to search for pertinent data and the types of models that should be evaluated using that data. Acquiring high-quality datasets has a significant impact on the quality and efficacy of the ML model. Think of the famous adage, “garbage in, garbage out.”
The most difficult job is collecting and acquiring quality data, which involves several tasks:
- Locate any relevant dataset that is readily accessible.
- Verify the accuracy of the information and the source of the data.
- Does the data provider abide by laws like the GDPR?
- What is the source type - static (files) or real-time streaming (sensors) - and how many sources are to be used?
- How to make the dataset available by creating a data pipeline that can power both the training and production environments.
- Which online (cloud) services are required?
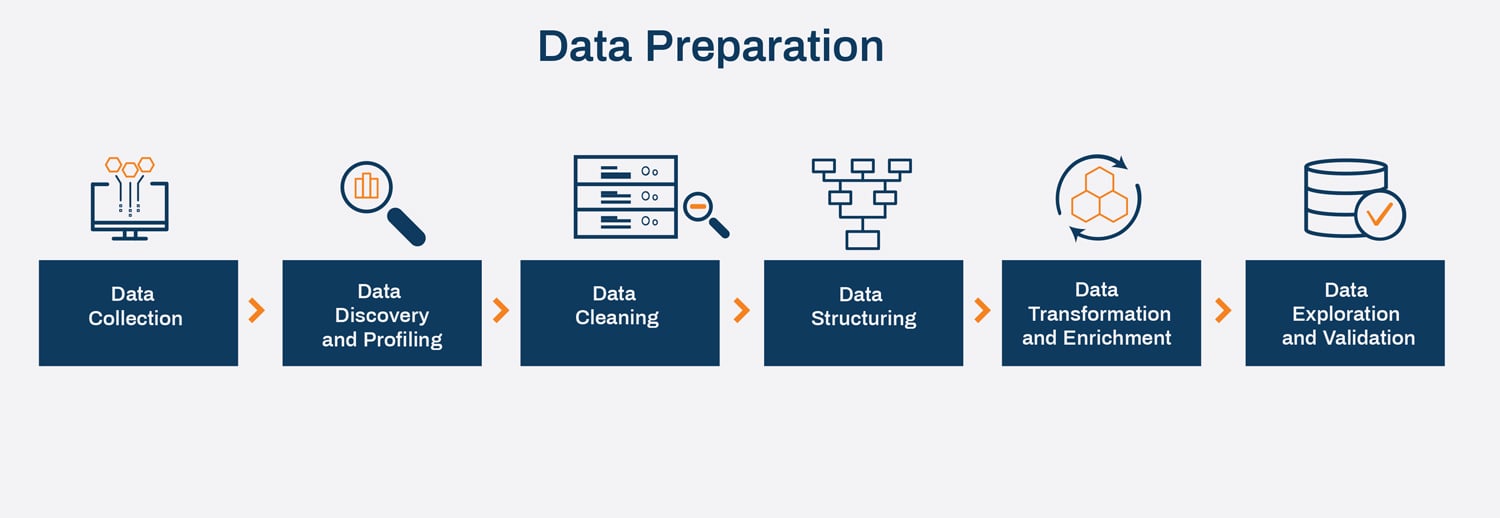
Data preparation
Machine learning models use data engineering pipelines to modify and prepare data for use in ML model training and deployment. Due to their role in ensuring the accuracy, applicability and high-quality data used to train models, these pipelines are essential to the success of ML initiatives.
Data collection, discovery/profiling, data cleaning/structuring, data transformation/enrichment and data exploration/validation are frequently included in data engineering processes. Data scientists and engineers can process huge amounts of data swiftly and effectively thanks to these structured, automated steps.
Data preparation is the procedure of gathering and importing data from various sources or systems into a storage or processing system, like a database, data lake or data warehouse, where it can be analyzed, cleaned, processed and used to produce insights or make informed choices. The data can originate from a broad range of sources, including databases, files, APIs and streaming data sources.
Data collection
The process of gathering the information needed to address a business problem is known as data collecting. Data collection happens in steps, and it’s crucial to realize that this is an iterative and repeating process. The steps are as follows:
- Data extraction: Data is taken from the source system in this phase. You might need to open a connection to a database or API, access the relevant data there, or read data from a file or stream.
- Data loading: The extracted data is loaded into the target system, such as a database or data warehouse, by inserting it into tables, adding new files or directories to a data lake, or sending the data to a streaming data platform.
Data discovery and profiling
After collecting data from many sources, the next step is to examine it to identify trends and patterns, known as data discovery. It offers information that may be applied to enhance business procedures to ensure the quality of the data.
When data quality is a top concern, data discovery and profiling is a crucial step. This stage assures the legitimacy and acceptable quality of the data you have access to. The insights gained at this stage help data professionals decide how to clean and transform the data to make it suitable for the intended analysis or application. It also aids in identifying potential issues early in the data preparation pipeline, reducing the risk of errors and ensuring that the data is of high quality and integrity.
Data cleaning
Raw data must be transformed into usable and practical formats to make it simpler for data scientists and engineers to evaluate and create models. It is not surprising that engineers and data scientists devote the bulk of their time to it. Data cleaning – also called data wrangling or cleansing – aims to increase the data’s suitability for analysis by making sure it is accurate, complete, consistent and usable. The quality of the data has an impact on the analysis. Inaccurate findings, erroneous conclusions and inadequate decision-making can result from poor data quality.
To reuse all these functionalities on future data, we advise creating scripts or functions for each data transformation in the data pipeline.
- Changes: Determine which changes are worth trying.
- Anomalies: Correct or eliminate anomalies (optional).
- Missing values: Drop their rows or columns or substitute zero, the mean or the median for missing values.
- Irrelevant data: Remove any attributes that do not offer any information applicable to the job.
- Restructure data: For example, reorder the columns, alter the dataset’s granularity and the fields lined to entries using aggregations, remove record groups from datasets to filter etc.
Data structuring
A mechanism for organizing data is known as a data structure. Data structures gather different kinds of data (both organized and unstructured), then transform it into information that is useful and meaningful. The objective is to organize data so that you may use it and it is suitable for further analysis and processing/enrichment.
Data transformation and enrichment
Data transformation can improve the effectiveness of business and analytical processes and allow for improved data-driven decision-making. For the greatest outcomes, advanced analytics needs structured and easily accessible data.
In order for data to be useful, it must be transformed from its original data source form into a format that is simple for software to use, as well as for users to grasp and comprehend.
Finding and comprehending the data in its source format is the fundamental stage in the data transformation process. This stage assists you in determining how to transform the data to achieve the required format. Other customized data transformation processes are as follows:
- Filtering, such as loading only particular columns.
- Adding details, such as adding the whole name to the first, middle and last names.
- Creating many columns out of one column and vice versa.
- Combining data from various sources.
- Removing duplicate data.
Data exploration and validation
The data exploration and validation stages are crucial because they help guarantee the data’s accuracy and suitability for analysis. Data analysts or data scientists look at the data to comprehend its characteristics, spot possible problems and assess its quality.
Data exploration entails examining the data to discover its patterns, connections and organizational structure. Data scientists visualize the data, compute summary figures, and find any outliers or anomalies. Potential problems with the data, such as missing values or inconsistencies, can be found through data exploration and fixed in the data wrangling (cleaning) portion. As you probably have realized, preparing your data for machine learning involves many steps that are intertwined.
The following steps are among the best practices for exploration and validation:
- Maintain data study and experimentation records when using web-based interactive development environments such as Jupyter Notebooks.
- Collect the information related to each attribute and record it.
- Identify the goal attribute for supervised learning tasks.
- Build a visual depiction of the value distribution using data visualization.
- Calculate and examine the correlations between characteristics.
- Identify additional information that will help develop the model.
Data validation is crucial to filter out big datasets and increase process effectiveness before moving to the next step, data splitting. But every exploration method or procedure has advantages and disadvantages; therefore it’s important to fully acknowledge both. Data validation can boost accuracy and quality to deliver the optimum working environment.
Data splitting
When a dataset is split into two or more subsets, a popular technique used in machine learning and data analysis is called data splitting. Although other divisions, like validation sets or cross-validation sets, may also be used, a dataset is typically divided into a training set and a test set. The ratio 80:20, which designates 80% of the data as training and 20% as assessment, is frequently employed. The ideal split between the test, validation and training sets relies on many variables, including the use case, model structure, data dimension, etc.
The size of the initial data pool or the number of predictors in a predictive model may impact how the data should be divided; there is no defined rule or metric for this. Organizations and data modelers may decide to divide data up based on data sampling techniques, such as the three methods listed below:
- Random selection: When using the random selection approach, each sample has an equal chance of being chosen. A randomly selected sample intends to reflect the entire population. For example, to get feedback on a product, a company can randomly select 500 customers from a dataset of 10,000 customers who purchased the product to complete a customer satisfaction survey. By using random selection, the surveyed customers will represent the company’s customer population that bought the product. This approach minimizes bias.
- Stratified selection at random: This data sampling technique divides a population into smaller subgroups, or strata, based on shared traits or features of the members and then conducts a random sampling. For instance, a business might be interested in targeting its customers ages 25-40 who made at least one purchase in the last year. Once this smaller group is identified, a random sampling is completed. This technique ensures that you target the right group or that each group is represented proportionally in a sample.
- Non-random selection: This technique selects data points for a reason based on the goals of the project, whereas a random selection has no pattern. For example, a 20,000-student educational institution might want to understand the differences between male and female students over the last three years. As a result, they would pull a sample with the same proportion of male and female students as the larger student body over the last three years to provide a genuine representation of the student body.
The subsequent analysis steps depend on careful consideration of the data selection procedure. Scientific conclusions will have dubious value if the data selection process is incorrect, notwithstanding efforts to maintain rigorous adherence to data collecting methods, selection of fitting statistical analyses, precise data reporting and an unbiased write-up.
Data must be prepared as stated in this blog to create precise and trustworthy machine learning solutions. This approach analyzes the data and presents a summary typically using visuals and provides a sneak peek into common patterns and helps data scientists in understanding the dataset better before modelling. Poor-quality data can have a negative impact on the quality of the analyses and models, mostly by limiting the generalizability of conclusions or producing underwhelming model results.
Once you’ve acquired relevant datasets and prepared it for your ML models, you’re set to build your AL/ML algorithms.
The stages of Model and Evaluate will be covered in the next blog in our AI series, "Critical steps for training and evaluating AI and ML models."