<img src="https://secure.leadforensics.com/133892.png" alt="" style="display:none;">

Formelspråket som används i Power BI heter DAX - Data Analysis Expressions . Språket utgörs av ett stort antal funktioner med konstanter och operatorer vilka används i formler och uttryck för att beräkna ett eller flera värden. DAX skapar helt enkelt ny information utifrån data som redan finns i din datamodell.

Funktionerna i DAX delar vi in i följande grupper: DATETIME, FILTER, INFO, LOGICAL, MATHTRIG, PARENTCHILD, STATISTICAL, TEXT, TIMEINTELLIGENCE samt OTHER.

DAX Function: DATE
Reference group: DATETIME

Du har kanske redan brottats en del med datumformat i Microsoft Excel och sitter nu med liknande problemställningar i Microsofts BI verktyg Power BI.

I Power BI finns kraftfulla, fördefinierade funktioner som är mycket användbara för att göra beräkningar över tid. För att kunna nyttja dessa funktioner måste man bl.a. ha alla aktuella datumangivelser i korrekta datumformat.

I de fall datum är i annat format, som separerade text eller numeriska fält, behöver de formateras om till korrekt datumformat. Detta gör man med DATE-funktionen. DATE-funktionen hittar du i referensgruppen DATETIME. I exemplen nedan visar vi hur du formaterar text och numeriska värden till ett specifikt datum.

DATE function (DAX)

DATE-funktionen tar heltal som argument och genererar motsvarande datum. Den underliggande data kan till exempel innehålla datum i ett format som inte är känt som ett datum utan som text eller numeriskt. En ny kolumn i datumformat skapas enkelt med syntax enligt nedan.

Syntax: DATE(<year>;<month>; <day>)

Exempel 1.

I exemplet nedan visar vi hur du skapar datumkolumnen ”DATE FRÅN TEXT” utifrån textfälten ÅR_TEXT, MÅNAD_TEXT och DAG_TEXT i Tabell 1.

Tabell 1
tabell1-1 

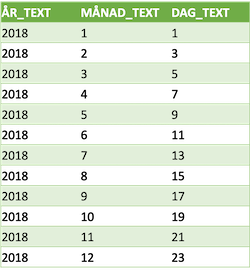
I funktionen DATE anger vi tabell och de textfält vi vill använda för att skapa en ny datumkolumn. För att skapa datumkolumnen “DATE FROM TEXT” använder vi följande syntax:

DATE FRÅN TEXT = DATE(’Tabell 1’[ÅR_TEXT]; ’Tabell 1’[MÅNAD_TEXT]; ’Tabell 1’[DAG_TEXT])

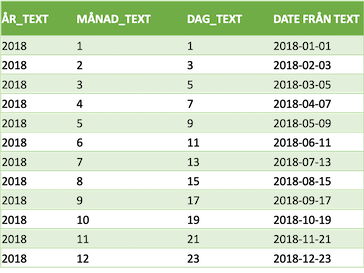
Tabell 1 efter att vi har använt ovanstående syntax.

DAX_tabell_1_1

Exempel 2.

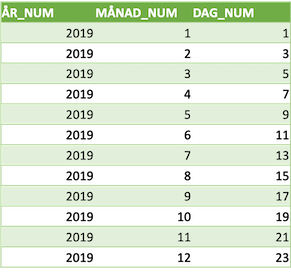
I exemplet nedan visar vi hur du skapar datumkolumnen ”DATE FRÅN NUM” utifrån de numeriska fälten ÅR_NUM, MÅNAD_ NUM och DAG_ NUM.

Tabell 2

 DAX_tabell_2

I funktionen DATE anger vi tabell och de numeriska fält vi vill använda för att skapa en ny datumkolumn. För att skapa datumkolumn “DATE FROM NUM” använder vi följande syntax:

DATE('TABELL 2'[ÅR_NUM];'TABELL 2'[MÅNAD_NUM];'TABELL 2'[DAG_NUM])

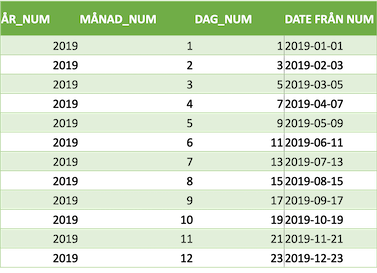
Tabell 2 efter att vi har använt ovanstående syntax.

DAX_tabell_2_1

Flera DATETIME funktioner (DAX)

Ovan har du fått exempel på hur du kan använda DATE funktionen för att skapa en datumkolumn. Det finns ytterligare 21 DATETIME-funktioner i Power BI.

Vill du veta mer vilka DATETIME-funktioner som finns i Power BI kan du ladda ner vår Power BI applikation som visar alla DATETIME funktioner.Ladda ner DATETIME

För att kunna använda Power BI applikationen behöver du ha Power BI Desktop installerad på din dator. Power BI Desktop är gratis och kan laddas ner här, https://powerbi.microsoft.com/sv-se/desktop/.

Om du inte redan har Power BI Desktop installerat och behöver hjälp med detta kan vi naturligtvis hjälpa till.

Håll utkik efter ytterligare blogginlägg på denna site. 

Prenumerera på bloggen

Diskutera detta inlägg

Rekommenderad läsning

If you organize your data and use AI strategically, you can make better decisions faster. You can for example improve your market understanding and forecasting, optimize your maintenance or reduce food waste. Choose what is most important for you!
Demand forecasters do the impossible — predict what products and services customers want in the future. Their forecasts inform decision-making about production and inventory levels, pricing, budgeting, hiring and more. "While crystal balls remain imaginary, machine learning (ML) methods can give global supply chain leaders the support they need in the real world to create more accurate forecasts." The goal is to produce exactly the amount of product to meet demand. No more. No less. Demand forecasting is used to anticipate the demand with enough time to manufacture the right stock to get as close to this reality as possible. The cost is high if you don’t get it right. Your customers will go to your competitors if you don’t have what they need. Unfortunately, capacity, demand and cost aren’t always known parameters. Variations in demand, supplies, transportation, lead times and more create uncertainties. Ultimately demand uncertainties greatly influence supply chain performance with widespread effects on production scheduling, inventory planning and transportation. On the heels of the global pandemic, supply chain disruptions and a pending economic downturn, many demand forecasters wish for a crystal ball. While crystal balls remain imaginary, machine learning (ML) methods can give global supply chain leaders the support they need in the real world to create more accurate forecasts.
If you have identified possible AI use cases for your business, the next step will be to test if they are possible to implement and if they will create great value. While there is a lot of momentum and excitement about using AI to propel your business, the reality is only 54% of AI projects are deployed. How do you ensure you’re one of the businesses that does unlock the new opportunities AI promises? Your success with AI begins by discovering AI use cases that work for your business. In the first blog of our Columbus AI blog series, we shared five areas where organizations should focus their efforts to generate ideas for AI implementations based on our experience. After generating some ideas for AI use cases that could potentially benefit your company from the first step of the Columbus AI Innovation Lab, the next step is to test which AI use cases could be operationalized by evaluating them. Columbus AI Innovation Lab
Only half of the companies starting an AI pilot project are actually executing it. The key is to choose an idea that will benefit your business. Read more about how! In 2022, 27% of chief information officers confirmed they deployed artificial intelligence (AI), according to a Gartner AI survey. Even though businesses across all industries are turning to AI and machine learning, prepare your organization before jumping on the AI bandwagon by considering a few factors. Ask yourself: Is AI necessary for achieving the project requirements or is there another way? Does your team have the skills to support AI and machine learning? How will AI impact your current operations if you adopt it? How will you integrate AI with existing systems? What are the data, security and infrastructure requirements of AI and machine learning? The Gartner AI survey found only 54% of projects made it from the pilot phase to production. After significant investment in AI, why aren’t companies deploying it? We found the problem begins when companies define a use case. Too often, companies are not identifying AI use cases that benefit their businesses and end-users will adopt. The question is then, how should companies unlock the value and new opportunities AI promises? It starts with a systematic approach for each stage of the AI life cycle. We developed the Columbus AI Innovation Lab, a comprehensive method to address and account for all challenges when adding AI to your business operations and bring stakeholders into the process at the right time to help you operationalize AI.
It doesn’t matter how good your artificial intelligence technology is. If you have bad data, you’ll get bad results. While AI is one of the most innovative and impactful innovations for businesses today, bad data can prevent AI projects from getting off the ground. Having high-quality data and following data preparation best practices are crucial for a successful AI project. In the Transform phase of the Columbus AI Innovation Lab, the one we detail here, data is collected and prepared for use by AI and machine learning (ML) algorithms. Major phases in Machine Learning Machine learning, frequently used synonymously with “artificial intelligence,” is about using predictive methods to simplify tasks. There are several essential steps to building ML models, and these steps can change based on the issue you are trying to solve and the kind of ML model you are building. However, in general, the steps involved in creating and implementing an ML model are as follows: Define: Different approaches for finding AI use cases Discover: Scope and prioritize ideas before developing an AI solution and implementation strategy Transform: Transforming the business case including data acquisition and preparation with AI/ML (current blog) Model and evaluate: Analyze and enhance the business use cases using AI/ML algorithms Deploy and support: Deployment of AI/ML models and support/monitoring to guarantee quality and effectiveness
right-arrow share search phone phone-filled menu filter envelope envelope-filled close checkmark caret-down arrow-up arrow-right arrow-left arrow-down right-arrow share search phone phone-filled menu filter envelope envelope-filled close checkmark caret-down arrow-up arrow-right arrow-left arrow-down