<img src="https://secure.leadforensics.com/133892.png" alt="" style="display:none;">

Formelspråket som används i Power BI heter DAX. Språket utgörs av ett stort antal funktioner med konstanter och operatorer vilka används i formler och uttryck för att beräkna ett eller flera värden. DAX skapar helt enkelt ny information utifrån data som redan finns i din datamodell.

Funktionerna i DAX delar vi in i följande grupper: DATETIME, FILTER, INFO, LOGICAL, MATHTRIG, PARENTCHILD, STATISTICAL, TEXT, TIMEINTELLIGENCE samt OTHER.

DAX Function: DISTINCTCOUNT

Reference group: STATISTICAL

Behöver du veta hur många unika värden som förekommer i din data? Med DISTINCTCOUNT-funktionen kan du räkna antalet unika värden i en specifik kolumn i din data, till exempel på hur många olika orter har du återförsäljare.

DISTINCTCOUNT function (DAX)  

DISTINCTCOUNT-funktionen räknar antalet unika värden i en kolumn oavsett vilken typ av data kolumnen innehåller. Funktionen räknar även tomma celler som ett unikt värde.

DISTINCTCOUNT generar inte en ny kolumn utan returnerar ett beräknat värde, ett så kallat Measure. Measures lagras inte i datamodellen utan beräknas vid varje tillfälle de anropas. Beroende på hur ett Measure används genereras olika resultat. Exempel på andra användningar av Measures kommer vi ta upp i andra bloggar.

Syntax: DISTINCTCOUNT(<column>)

I exemplen använder vi en tabell som heter DATA med 5 kolumner enligt nedan:
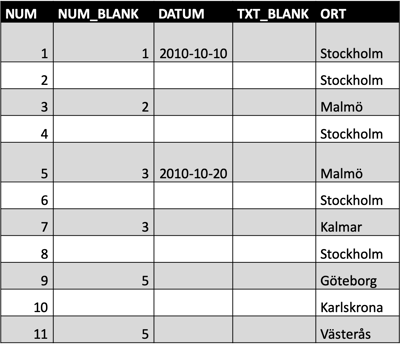
DAX-exempel

Exempel 1.

I exemplet räknar vi antalet unika värden i kolumnen NUM. Measure ”Distinct_NUM” används och innehåller resultatet. Kolumnen är numerisk och inga celler är tomma.

Distinct_NUM = 11

För att beräkna unika antalet värden använder vi följande syntax:

Distinct_NUM = DISTINCTCOUNT(’DATA’[NUM])

Exempel 2.

I exemplet räknar vi antalet unika värden i kolumnen NUM_BLANK. Measure ”Distinct_NUM_BLANK” används och innehåller resultatet. Kolumnen är numerisk och det förekommer tomma celler.

Distinct_NUM_BLANK = 5

För att beräkna unika antalet värden använder vi följande syntax:

Distinct_NUM_BLANK = DISTINCTCOUNT(’DATA’[NUM_BLANK])

Exempel 3.

I exemplet räknar vi antalet unika värden i kolumnen DATUM. Measure ”Distinct_DATUM” används och innehåller resultatet. Kolumnen är en datumkolumn och det förekommer tomma celler.  

Distinct_DATUM = 3

För att beräkna unika antalet värden använder vi följande syntax:

Distinct_DATUM = DISTINCTCOUNT(’DATA’[DATUM])

Exempel 4.

I exemplet räknar vi antalet unika värden i kolumnen TXT_BLANK. Measure ”Distinct_TXT_BLANK” används och innehåller resultatet. Kolumnen är en textkolumn men innehåller bara tomma celler.

Distinct_TXT_BLANK = 1

För att beräkna unika antalet värden använder vi följande syntax:

Distinct_TXT_BLANK = DISTINCTCOUNT(’DATA’[TXT_BLANK])

Exempel 5.

I exemplet räknar vi antalet unika värden i kolumnen ORT. Measure ”Distinct_ORT” används och innehåller resultatet. Kolumnen är en textkolumn och inga celler är tomma.

Distinct_ORT = 6

För att beräkna unika antalet värden använder vi följande syntax:

Distinct_ORT = DISTINCTCOUNT(’DATA’[ORT])

Flera STATISTICAL funktioner (DAX)

Ovan har du fått exempel på hur du kan räknar antal unika värden i kolumner med DISTINCTCOUNT-funktionen. Det finns ytterligare 68 STATISTICAL-funktioner i Power BI.

Vill du veta mer vilka STATISTICAL-funktioner som finns i Power BI? Ladda då ner vår Power BI applikation som visar alla STATISTICAL-funktioner.

Ladda ner STATISTICAL

För att kunna använda Power BI applikationer behöver du ha Power BI Desktop installerad på din dator. Power BI Desktop är gratis och kan laddas ner här, https://powerbi.microsoft.com/sv-se/desktop/.

Vi kan naturligtvis hjälpa till med installation och att komma igång med PBI.

Håll utkik efter ytterligare blogginlägg.

Ämnen

Diskutera detta inlägg

Rekommenderad läsning

Vad är Microsoft Fabric? Microsoft Fabric är en heltäckande analyslösning för företag som omfattar allt från dataförflyttning till data sceince, realtidsanalys och business intelligence. Det erbjuder en omfattande uppsättning tjänster, inklusive data lake, datatransformation och integrering, allt på ett och samma ställe. Fabric sätter en ny standard for dataplattformar.
If you organize your data and use AI strategically, you can make better decisions faster. You can for example improve your market understanding and forecasting, optimize your maintenance or reduce food waste. Choose what is most important for you!
Demand forecasters do the impossible — predict what products and services customers want in the future. Their forecasts inform decision-making about production and inventory levels, pricing, budgeting, hiring and more. "While crystal balls remain imaginary, machine learning (ML) methods can give global supply chain leaders the support they need in the real world to create more accurate forecasts." The goal is to produce exactly the amount of product to meet demand. No more. No less. Demand forecasting is used to anticipate the demand with enough time to manufacture the right stock to get as close to this reality as possible. The cost is high if you don’t get it right. Your customers will go to your competitors if you don’t have what they need. Unfortunately, capacity, demand and cost aren’t always known parameters. Variations in demand, supplies, transportation, lead times and more create uncertainties. Ultimately demand uncertainties greatly influence supply chain performance with widespread effects on production scheduling, inventory planning and transportation. On the heels of the global pandemic, supply chain disruptions and a pending economic downturn, many demand forecasters wish for a crystal ball. While crystal balls remain imaginary, machine learning (ML) methods can give global supply chain leaders the support they need in the real world to create more accurate forecasts.
If you have identified possible AI use cases for your business, the next step will be to test if they are possible to implement and if they will create great value. While there is a lot of momentum and excitement about using AI to propel your business, the reality is only 54% of AI projects are deployed. How do you ensure you’re one of the businesses that does unlock the new opportunities AI promises? Your success with AI begins by discovering AI use cases that work for your business. In the first blog of our Columbus AI blog series, we shared five areas where organizations should focus their efforts to generate ideas for AI implementations based on our experience. After generating some ideas for AI use cases that could potentially benefit your company from the first step of the Columbus AI Innovation Lab, the next step is to test which AI use cases could be operationalized by evaluating them. Columbus AI Innovation Lab
Only half of the companies starting an AI pilot project are actually executing it. The key is to choose an idea that will benefit your business. Read more about how! In 2022, 27% of chief information officers confirmed they deployed artificial intelligence (AI), according to a Gartner AI survey. Even though businesses across all industries are turning to AI and machine learning, prepare your organization before jumping on the AI bandwagon by considering a few factors. Ask yourself: Is AI necessary for achieving the project requirements or is there another way? Does your team have the skills to support AI and machine learning? How will AI impact your current operations if you adopt it? How will you integrate AI with existing systems? What are the data, security and infrastructure requirements of AI and machine learning? The Gartner AI survey found only 54% of projects made it from the pilot phase to production. After significant investment in AI, why aren’t companies deploying it? We found the problem begins when companies define a use case. Too often, companies are not identifying AI use cases that benefit their businesses and end-users will adopt. The question is then, how should companies unlock the value and new opportunities AI promises? It starts with a systematic approach for each stage of the AI life cycle. We developed the Columbus AI Innovation Lab, a comprehensive method to address and account for all challenges when adding AI to your business operations and bring stakeholders into the process at the right time to help you operationalize AI.
right-arrow share search phone phone-filled menu filter envelope envelope-filled close checkmark caret-down arrow-up arrow-right arrow-left arrow-down right-arrow share search phone phone-filled menu filter envelope envelope-filled close checkmark caret-down arrow-up arrow-right arrow-left arrow-down