
Microsoft’s data visualisation tool has come a long way since it was first released in the form we know today, back in 2015. Now, in 2019 the solution is a leader in Gartner’s magic quadrant for Analytics and Business Intelligence thanks to its combination of simple user experience for the occasional report maker through to advanced features backed by powerful machine learning tech.
So, if you’re looking for a way to rapidly unlock the value hidden within your data, this article presents our top 5 features that you can leverage to get meaningful, actionable insights into the hands of your operational managers and discover how to set up Power BI with Dynamics 365 for Customer Engagement.
Uncover 5 major business benefits of Microsoft Power BI;
1. Get Started for Free and Consolidate your Data
The Power BI desktop app is a report development environment, that you can download for free. This makes proving the value to the business an easy win if you can pull together some powerful visuals that demonstrate what can be achieved in a short time.
Rarely does the business data you need to analyse sit in one place, however. So, the first task you’re likely to face is to connect to and model the relationships within the information to hand.
The two most common blockers to businesses that we see in this area are :
- The lack of a single version of the truth
- The time is taken to specify and develop reports from a central IT team.
Power BI can help solve both issues, and with a little training, operational managers can self-serve from a data model owned and governed with a known and trusted lineage.
For instance, imagine we want to build a sales analysis report using data from Microsoft Dynamics 365 Customer Engagement (CE) and Microsoft Dynamics 365 Business Central (BC) and have extracted the following tables from two data sources:
- Account (CE)
- Opportunities (CE)
- Sales Orders (BC)
- The salesperson (BC)
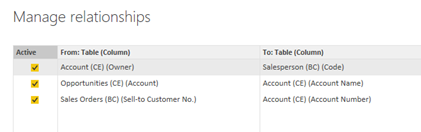
Microsoft D365 Customer Engagement (CE) is used to capture customer information and opportunities. While sales orders and salesperson information are stored in Microsoft Dynamics 365 Business Central (BC). The account and the opportunities only capture the salesperson code while their full name is stored in BC. These tables have been imported into the same PowerBIi file and using PowerBI functionality we can merge the data from both systems to get the desired information.
Using the merge function, we can combine both tables, here’s how:
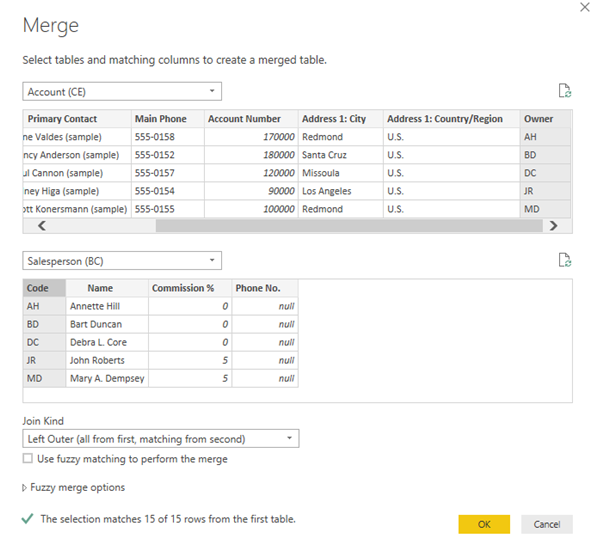
Click OK.
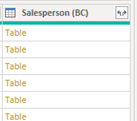
Now you see an additional column that references the salesperson table:
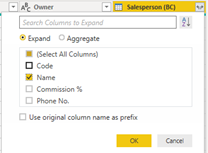
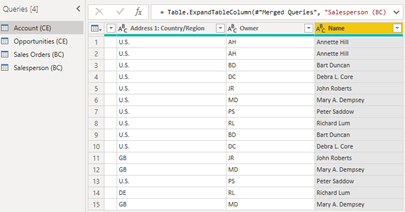
Just expand it to get the desired column with the full name:
Additionally, we can also create relationships between the tables.
See below:
2. Add your own Custom Calculations
Once your data model is defined, you’ll likely find that there are additional pieces of information required that can be derived from summarising or performing calculations on the rows and columns within it.
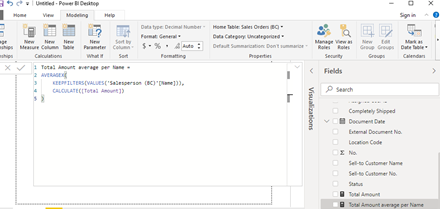
Microsoft Power BI services gives you a powerful and intuitive method of creating these calculations, which are known as measures. In the tool, you can add your custom calculations by using DAX (Data Analysis Expression) formula. Below is an example of how to create a calculated measure:

Also, you can create quick measures with Power BI which does not require you to have DAX knowledge:
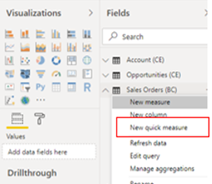
Click new quick measure:
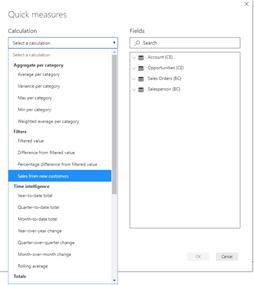
You have various options to pick from, before the app automatically creates the DAX formula for you:
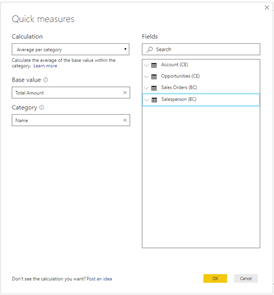
See the result below:
3. Blow them away with a Stunning Dashboard
Power BI is a supreme method of getting impactful business dashboards in front of the people that matter. The tool’s security and distribution features enable the dissemination of reports that contain up-to-the-minute metrics to help you steer operations. Reports are published to the cloud and maintain the same level of security you’d expect from an Enterprise-class product.

In Power BI service, create an app workspace:
To do this, sign into Power BI online
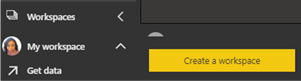
Under workspaces create a new workspace
Give it a name and a description:
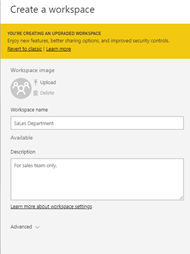
Click save
Now the work space will appear under the list of work spaces you have in your Power BI service
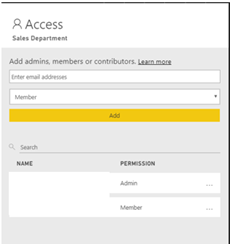
Click the three dots next to it… and add members to your Work space.
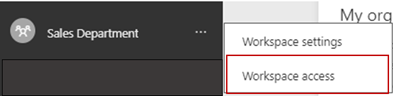
Only give access to people that need to publish a report to the workspace. End users don’t need access to the workspace.
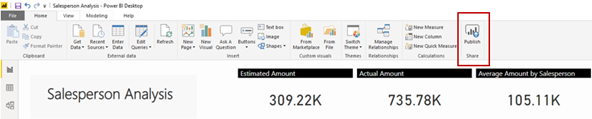
Once all this setup is done, go back to your desktop file and publish the report to that workspace.
The screen below will pop up for you to select your workspace:
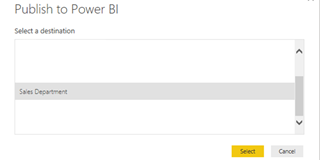
Click select.
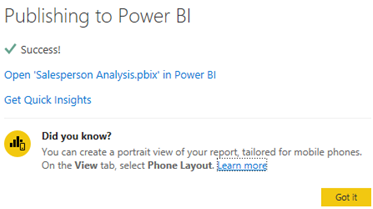
You will see the message below once it’s done, you can also open the report from here.
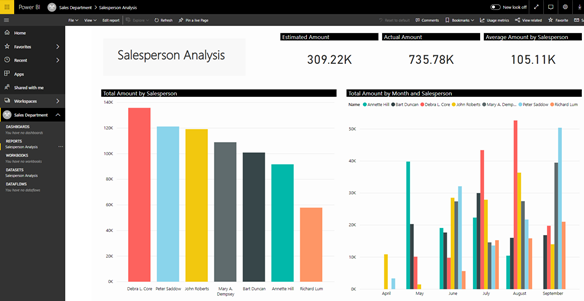
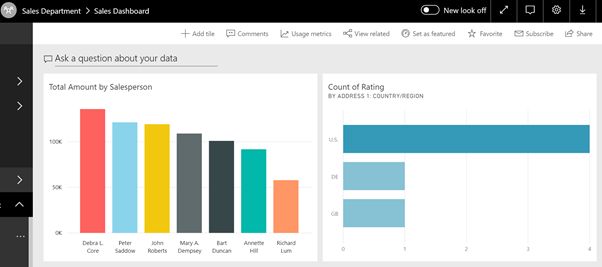
Below is the report as displayed in the Power BI Service:
The next thing is to share the app with the respective end-users:
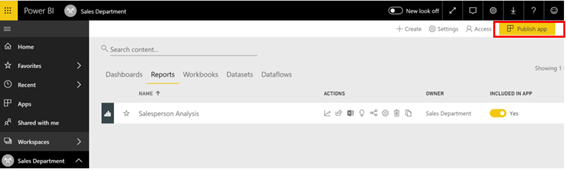
Click on publish app
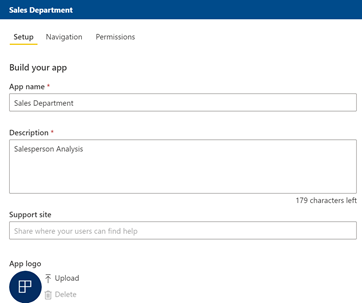
The below page appears allowing you to add a description.
Click on permission to specify the people that can access the report:
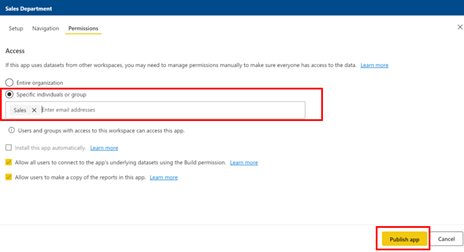
Click publish app when you are done setting permissions:
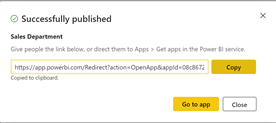
Copy the link and email it to the specific individual or the group you want to share the report with.
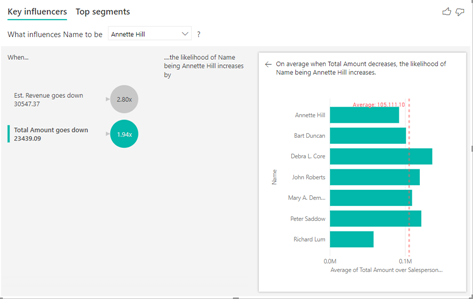
4. Find your Key Influencers
Want to really understand the drivers behind a particular KPI or Metric? The Key Influencers visualisation can help pick apart the key aggregated inputs and show you the underlying effects that are implied by the relationships between categorisations and measures within a dataset.
This could be particularly useful when analysing the results of a survey or other data sets related to customer experience.
5. Uncover the Insights
Ok, so you now have some data in your model, your new dashboard is looking sharp and you understand the factors driving the management information you’re seeing. What if you could wave a magic wand and discover some interesting trends, outliers or other anomalies that you may have not even realised were concealed within the business.
PowerBI can use advanced statistical analyses of the kind normally found within machine learning applications to root out these undiscovered insights. To see these quick insights on your data, go to the dataset section and click the three dots next to the dataset in question.
The options below appear:
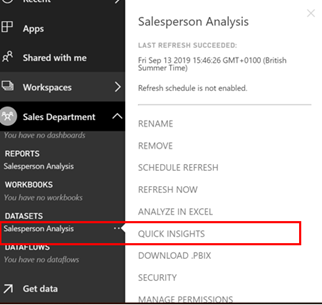
Click quick insights.
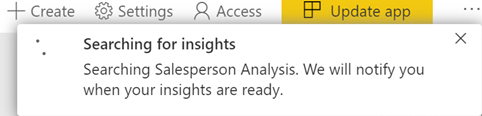
You get below message when the process starts:
You get below when the search is complete:
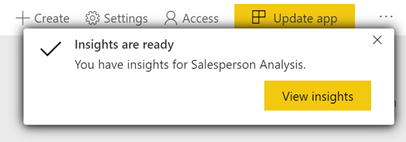
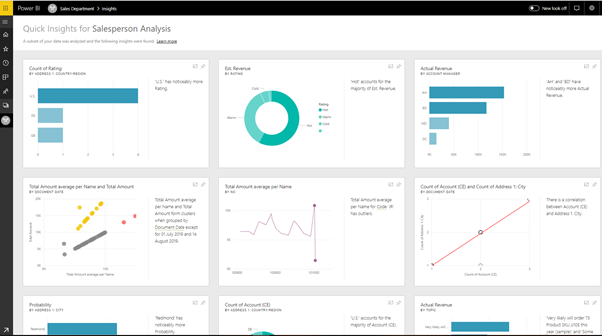
Click view insights, the below screen opens with a list of visuals:
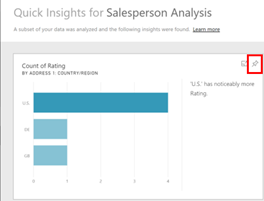
You can use the pin next to each visual to add it to an existing or new dashboard.
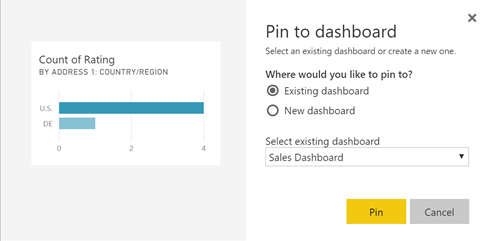
Below is the pined visual on an existing dashboard:
What are you waiting for?
The Columbus analytics team knows the data that helps monitor, control and grow your business. If you’re ready to take the next step in providing world-class management information capabilities to a department, team or entire organisation, contact us today.
Our Microsoft Power BI training services, and accelerator packages of data modelling and visualisation design can help teams get started in secure, accurate and timely reporting. Utilising these modern tools, won’t cost the earth and will enable you to steer your business on a course to digitally transforming your business.
Let us help turn you into an exemplar of data-driven best practice, whatever your industry segment. Feel free to contact Columbus by clicking here at any time in order to speak to one of our Power BI consultants about how we can help transform your business digitally.